

Phone: (626) 665-2335
![]()
Clients:
Association of Regional Center Agencies
California Employment Lawyers Association
California Manufacturers and Technology Association
Comcast
Comgenex
Dicaro, Coppo & Popcke
Dicaro Mediation
Five65
Happy Wish Company
Hyundai
IDG Books
Intel
The McClatchy Company
McNally Temple Associates
New Orleans Times-Picayune
Paul Mediation
Port of New Orleans
Radisson
Rice-a-Roni
Senior Softball-USA
Sunsweet
The Sacramento Bee
University of New Orleans
University of San Francisco
Yale University
Informational graphics explain complex events or processes in a clear, concise, visually-pleasing manner. They can be static images, animations or even interactive kiosks. Infographics are best used to explain what would be cumbersome as text alone.
Illustration


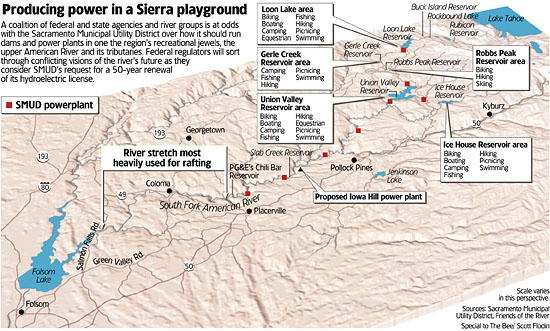
TERRAIN MAP July 17, 2005
The Sacramento Bee – Map with story about recreation and energy production on the South Fork of the American River.
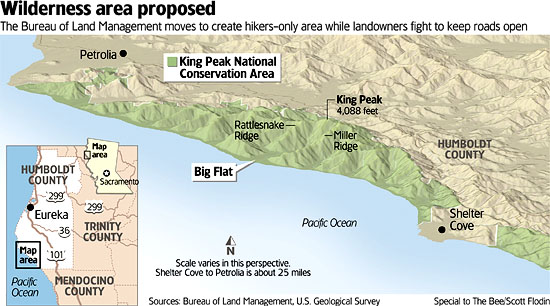
TERRAIN MAP April 24 and July 15, 2005
The Sacramento Bee – Map with stories about 300,000 acres of federal land along the North Coast of California
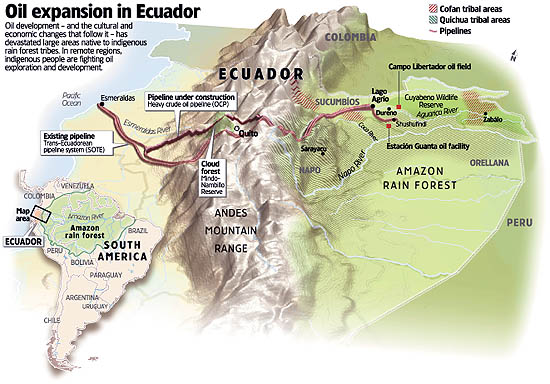
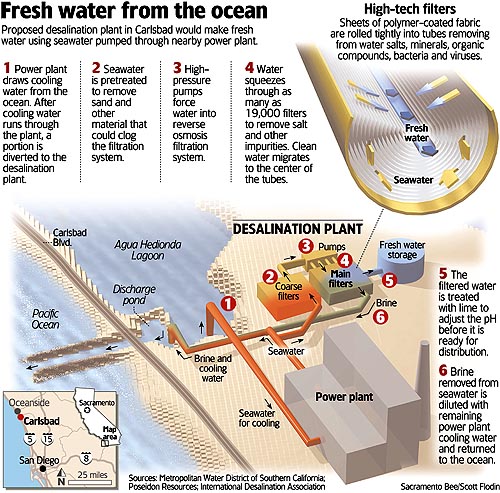
GRAPHIC published in The Sacramento Bee, April 27, 2003
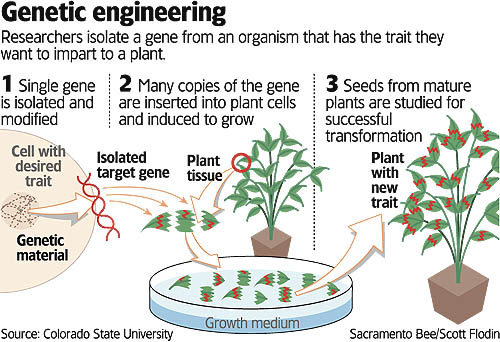
GRAPHIC published in The Sacramento Bee, June 24, 2003
Graphic published in The Sacramento Bee, Jan. 23, 2002
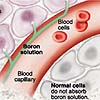
Medical

|
||
Explanatory and news


|
||
"On-the-scene"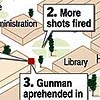
|
Interactive
|
Maps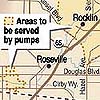
|
Illustration
TERRAIN MAP July 17, 2005
The Sacramento Bee – Map with story about recreation and energy production on the South Fork of the American River.
TERRAIN MAP April 24 and July 15, 2005
The Sacramento Bee – Map with stories about 300,000 acres of federal land along the North Coast of California
GRAPHIC published in The Sacramento Bee, April 27, 2003
GRAPHIC published in The Sacramento Bee, June 24, 2003
Graphic published in The Sacramento Bee, Jan. 23, 2002